1 in 3 Americans Now Lives Alone

Who are Americans today?
There were 13 scrappy British colonies 250 years ago that decided to step out on their own. And today, the US has 50 states and more people, households, and ways of living than the founders could have anticipated. So, who are Americans in this historic moment? Here’s a semiquincentennial snapshot of America today.
America’s population is aging
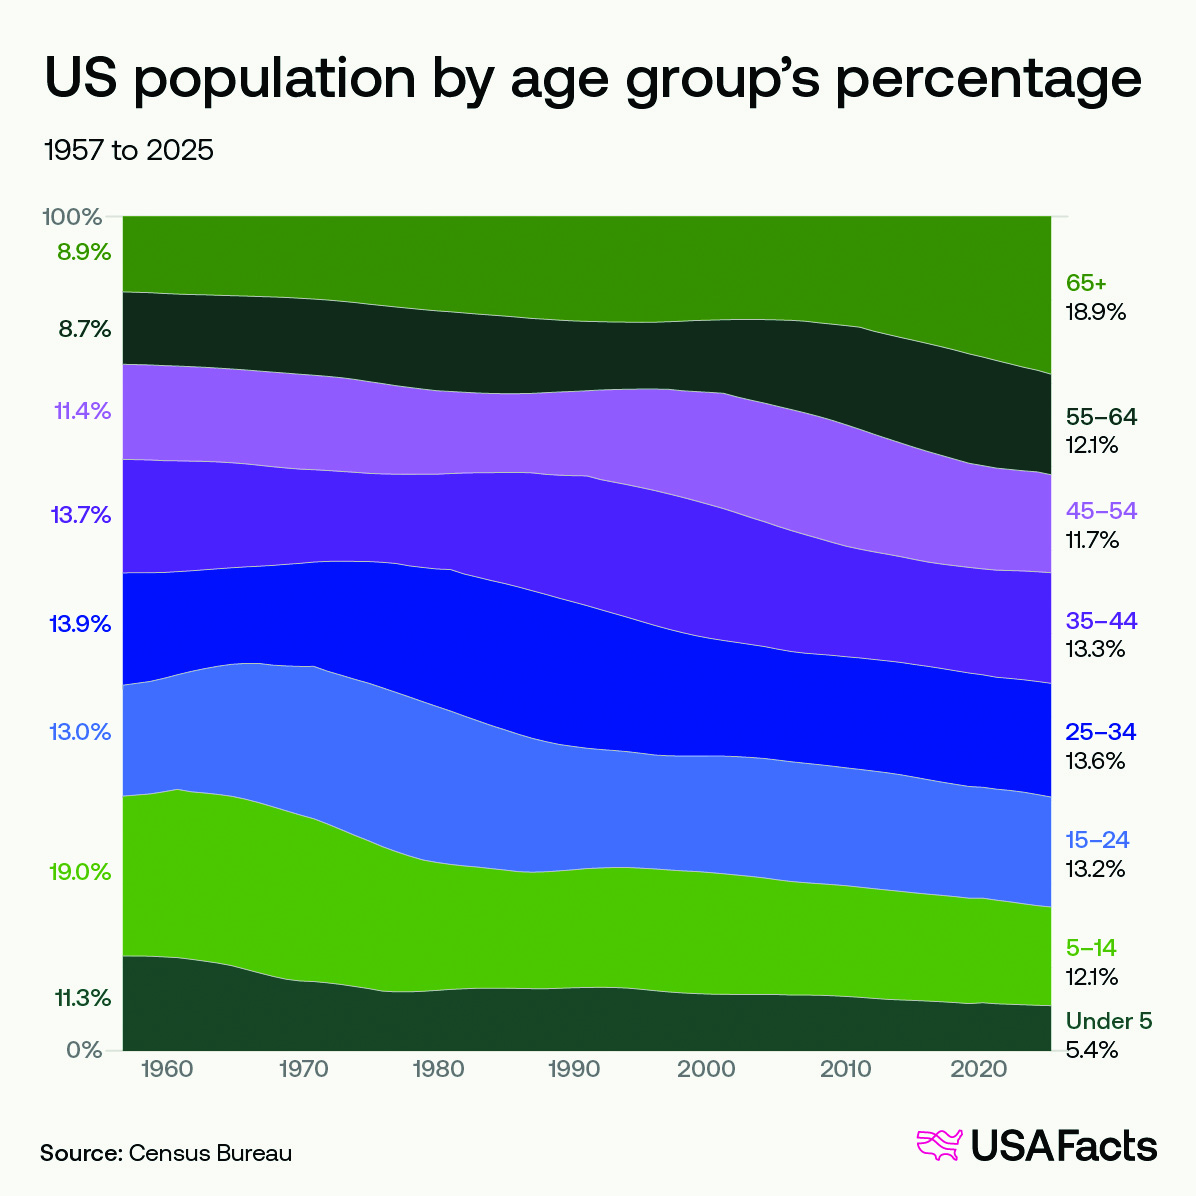
The country’s largest age group is people who are 65 and older. Last year, 18.9% of people in the US, or nearly one in five, were in this age group. The number of births in the US hit a record high in 1957 at 4.3 million. These babies turned 65 in 2022.
People between the ages of 25 and 34 are the country's second-largest age demographic. They comprise 13.6% of the population.
More people are living alone
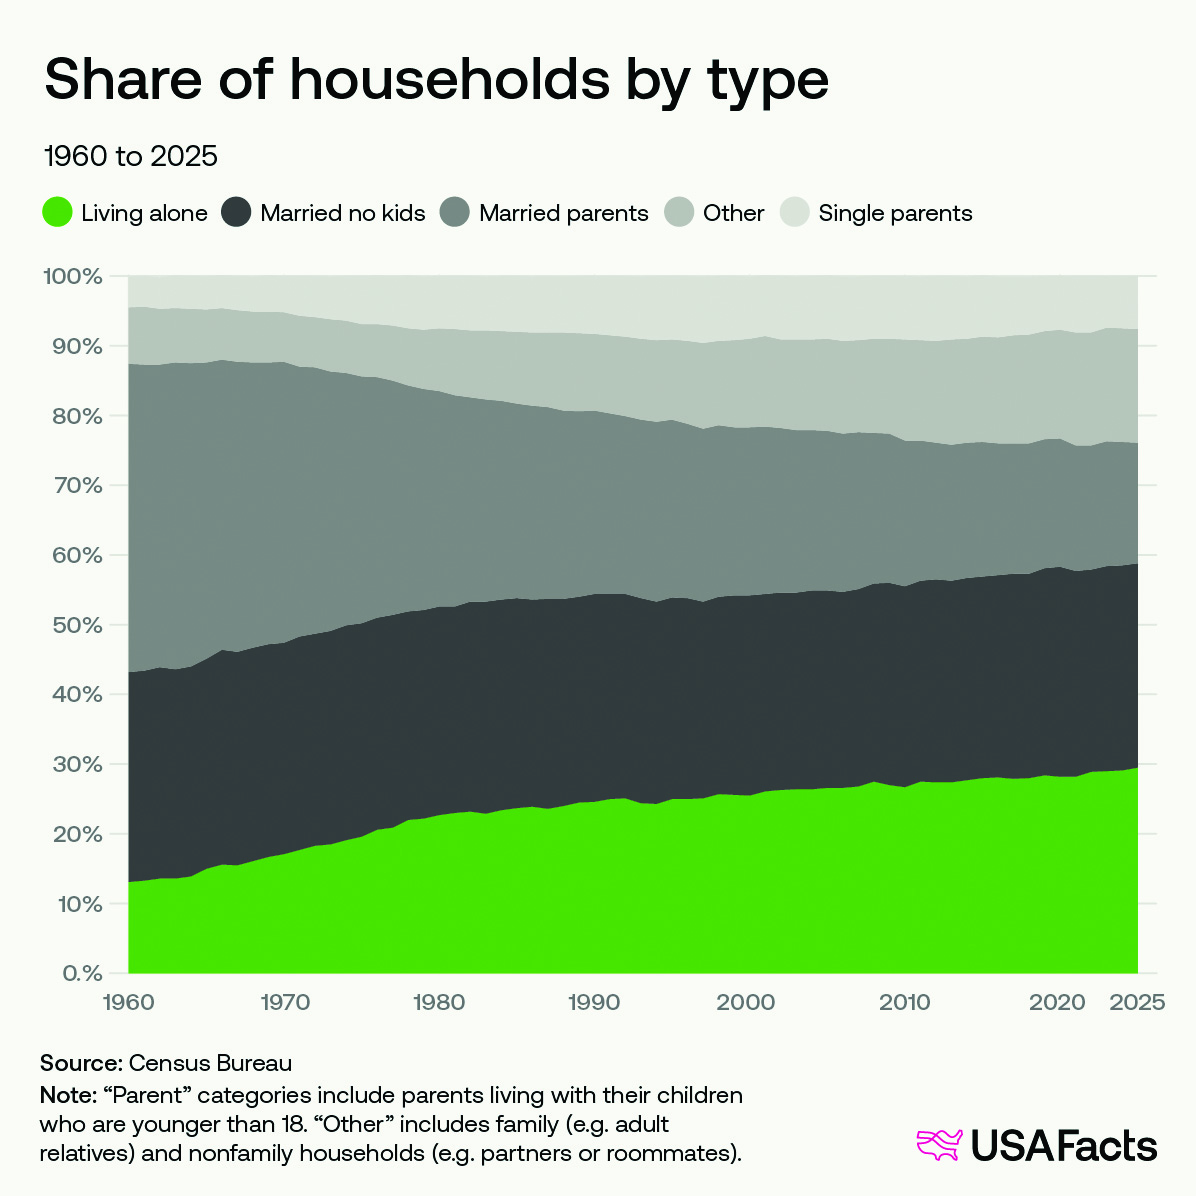
In recent decades, the most common type of US household has been those headed by a married couple without children under 18 in the home. But last year, people living alone comprised the largest share of households (29.5%) for the first time. Nearly three out of every 10 people lived on their own.
Married couples without children under 18 were the second-largest group, accounting for 29.3% of households. This includes both married couples with children older than 18 (even if they live at home) and married couples without any children.
Married parents headed 17.3% of households, while single parents headed 7.6%.
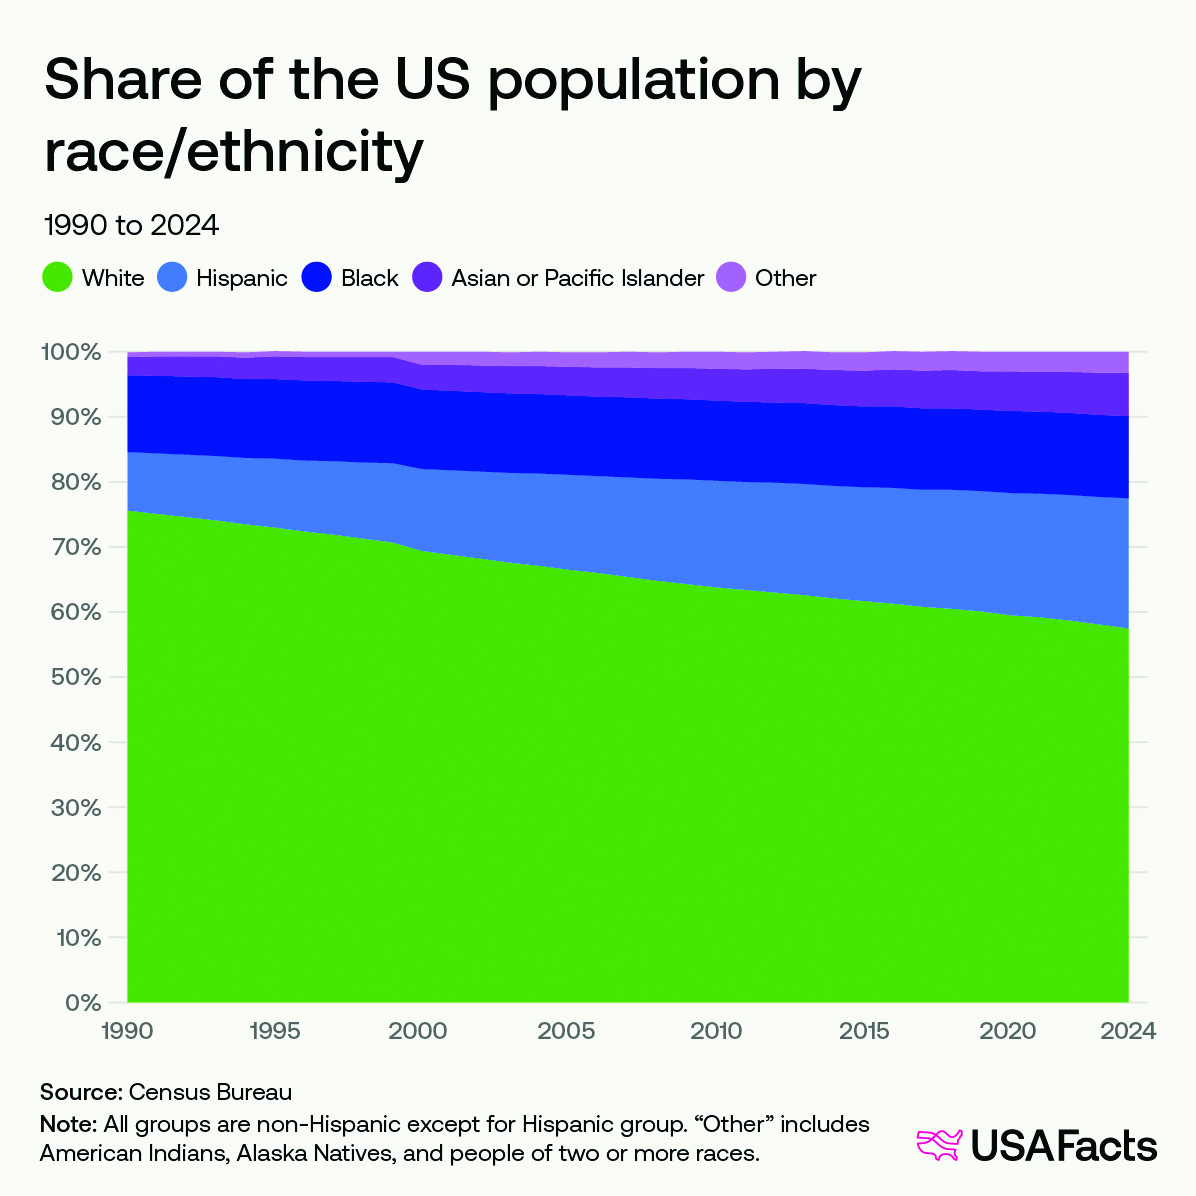
The population’s getting more diverse
In 1990, 75.6% of people in the US identified as white and non-Hispanic. By 2024, 57.5% did, a difference of 18.1 percentage points.
The share of all other racial and ethnic groups, as measured in the census, increased over the same period. The Hispanic share of the population more than doubled from 9.0% to 20.0%, making it the nation’s second-largest racial or ethnic group.
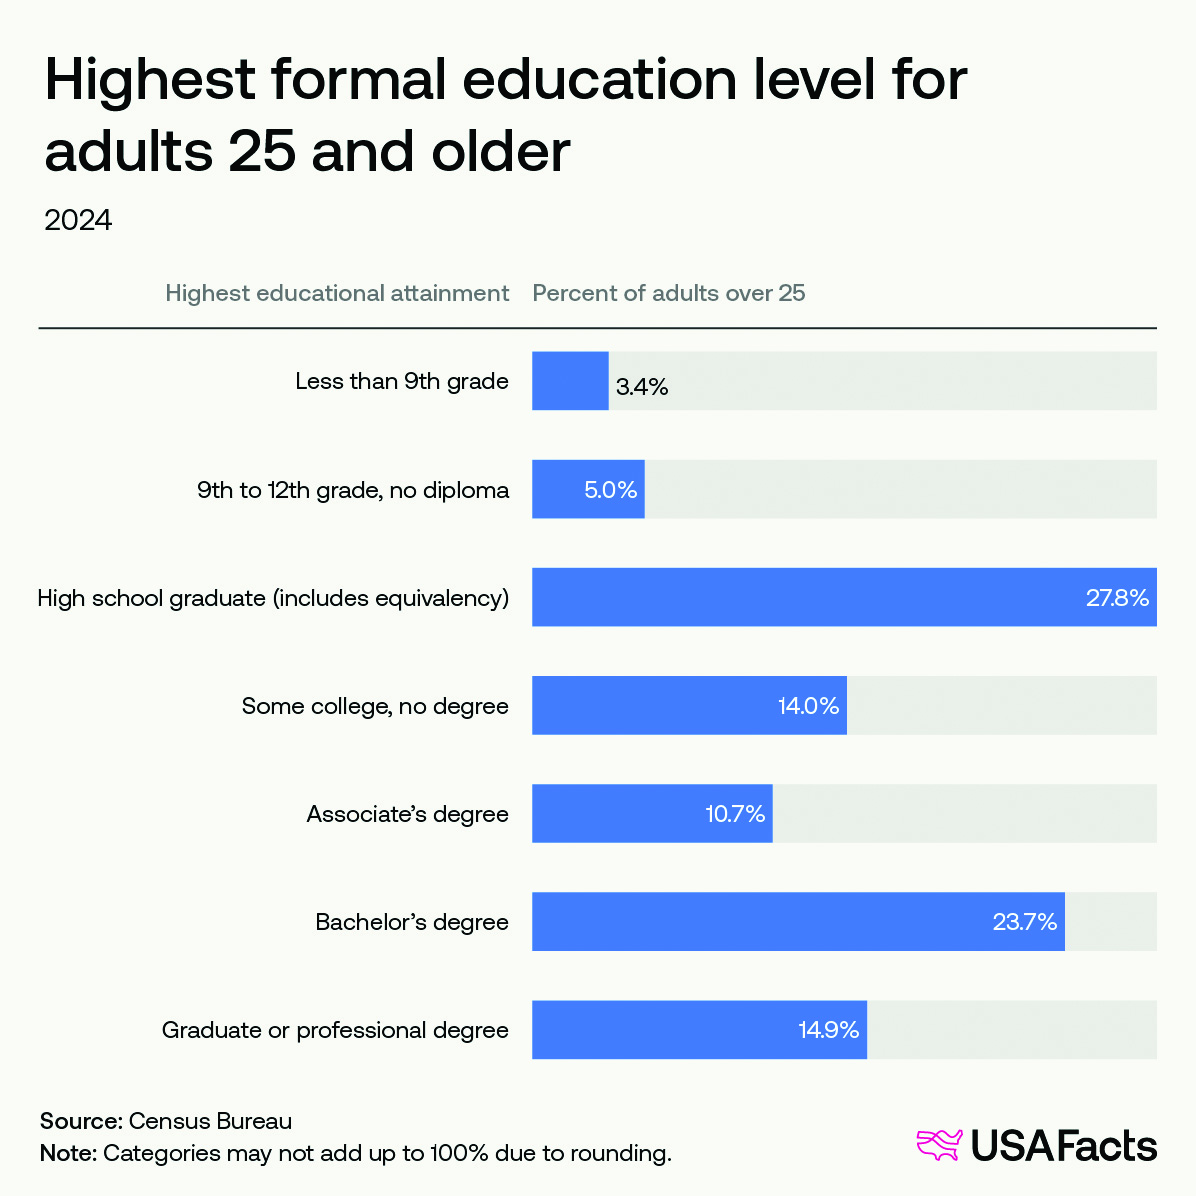
Nearly 50% of adults have a college education
In 2024, 49.3% of people who were 25 or older held a postsecondary degree. The largest percentage of people had a bachelor’s degree as their highest level of education (23.7%), and the second-largest was a graduate or professional degree (14.9%).
Another 27.8% had completed high school, while 8.4% had less than a complete high school education.
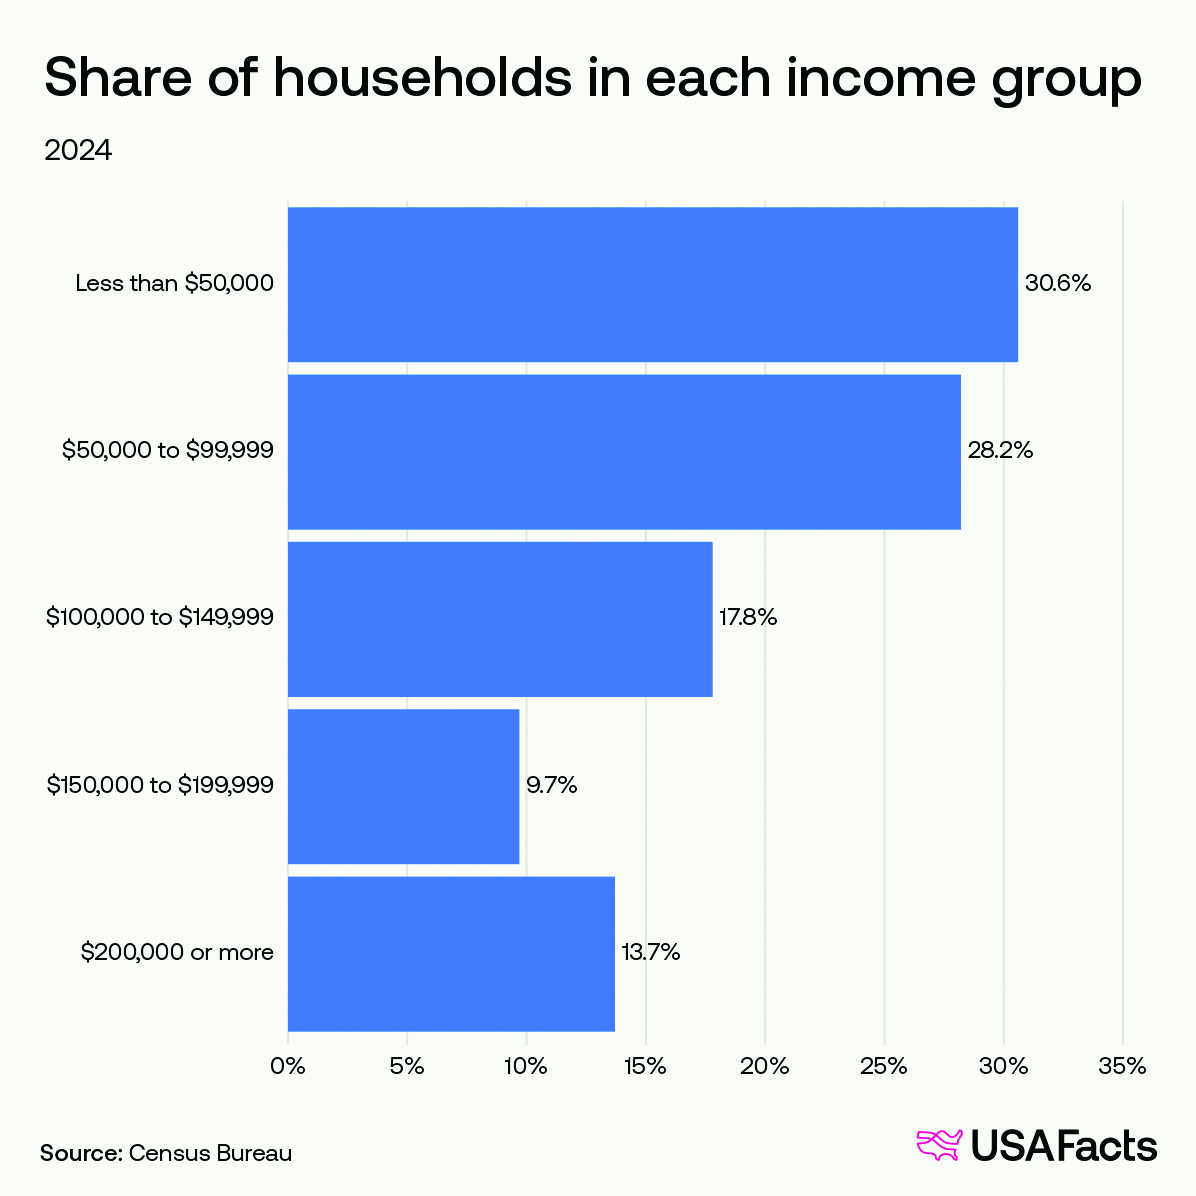
Household income
The median household income nationwide was $81,600 in 2024. (Household income is the total money received in a year — wages, pensions, investments, public assistance, and more — by everyone in a household older than 15.)
That same year, 41.2% of households made $100,000 or more, 28.2% made between $50,000 and $99,999, and 30.6% made less than $50,000.